Welcome to the XAI docs - eXplainable machine learning
Welcome to the xai documentation. Here you will the installation guide, the quick start guide, and the detailed docstrings code documentation of the xai library.
The documentation is currently under construction - for the meantime you can check out the main Github repository for the code (https://github.com/EthicalML/xai).
About
XAI is a Machine Learning library that is designed with AI explainability in its core. XAI contains various tools that enable for analysis and evaluation of data and models. The XAI library is maintained by The Institute for Ethical AI & ML, and it was developed based on the 8 principles for Responsible Machine Learning.
You can find the documentation at https://ethicalml.github.io/xai/index.html. You can also check out our talk at Tensorflow London where the idea was first conceived - the talk also contains an insight on the definitions and principles in this library.
0.0.4 - ALPHA Version
This library is currently in early stage developments and hence it will be quite unstable due to the fast updates. It is important to bare this in mind if using it in production.
What do we mean by eXplainable AI?
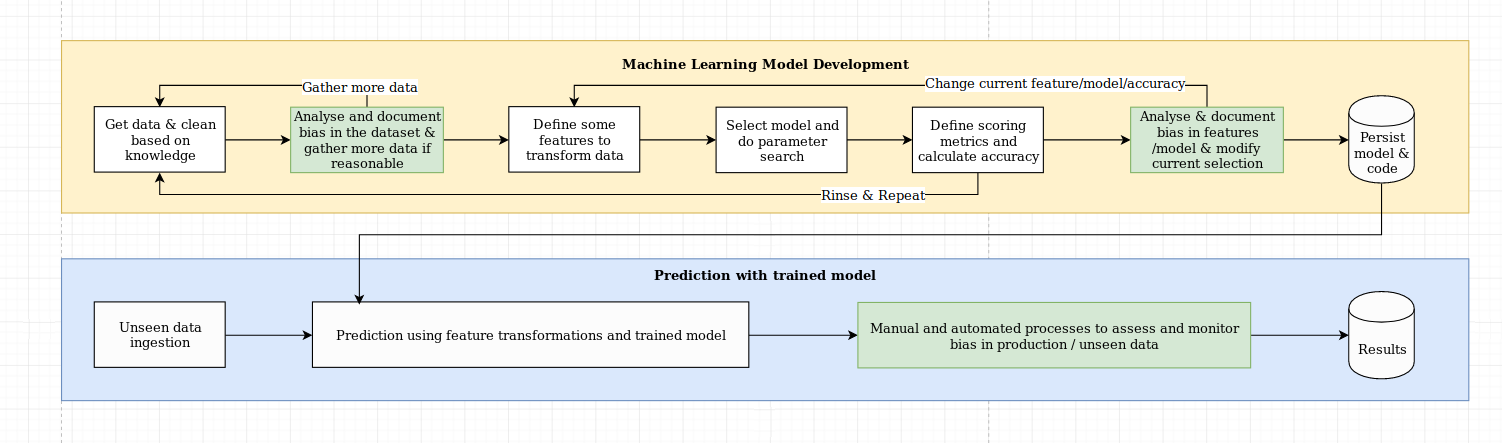
We see the challenge of explainability as more than just an algorithmic challenge, which requires a combination of data science best practices with domain-specific knowledge. The XAI library is designed to empower machine learning engineers and relevant domain experts to analyse the end-to-end solution and identify discrepancies that may result in sub-optimal performance relative to the objectives required. More broadly, the XAI library is designed using the 3-steps of explainable machine learning, which involve 1) data analysis, 2) model evaluation, and 3) production monitoring.
We provide a visual overview of these three steps mentioned above in this diagram:
XAI Quickstart
Installation
The XAI package is on PyPI. To install you can run:
pip install xai
Alternatively you can install from source by cloning the repo and running:
python setup.py install
Usage
You can find example usage in the examples folder.
1) Data Analysis
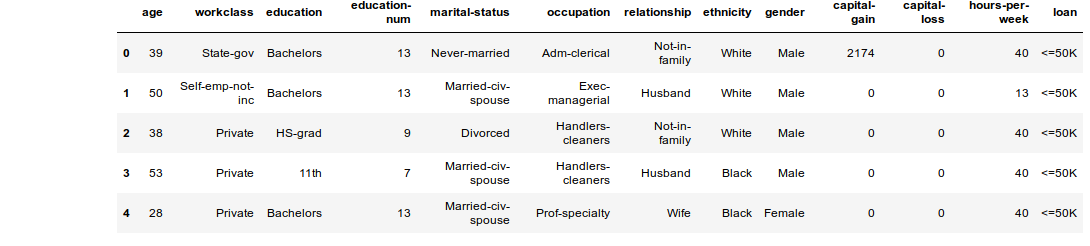
With XAI you can identify imbalances in the data. For this, we will load the census dataset from the XAI library.
import xai.data
df = xai.data.load_census()
df.head()
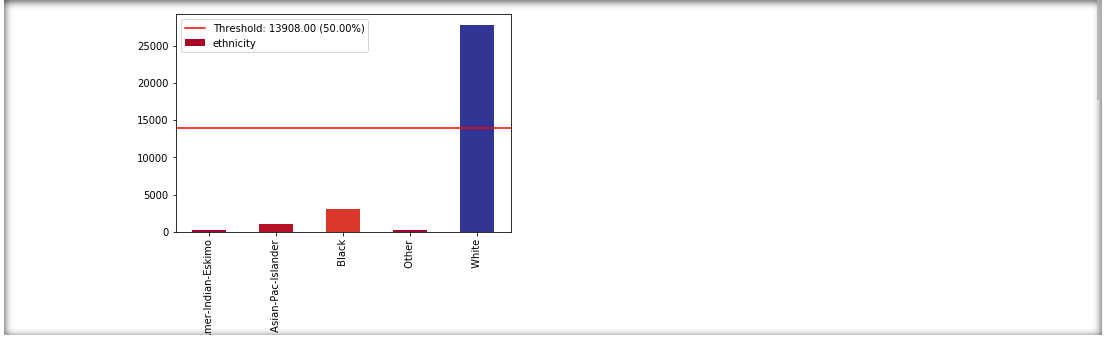
View class imbalances for protected columns
protected_cols = ["gender", "ethnicity", "age"]
ims = xai.show_imbalances(df, protected_cols)
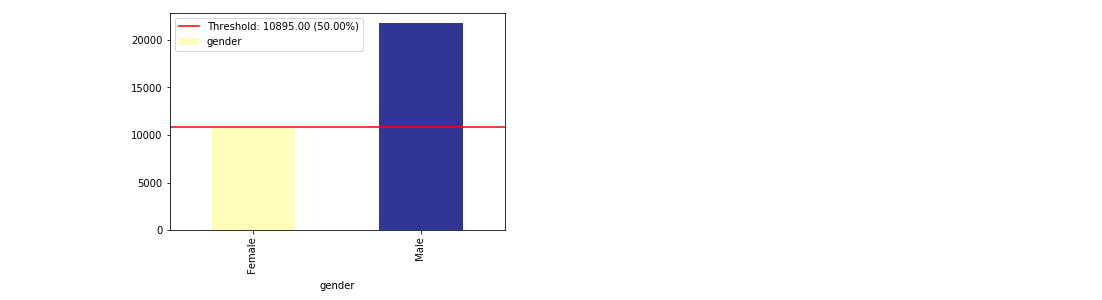
View imbalance of one column
im = xai.show_imbalance(df, "gender")
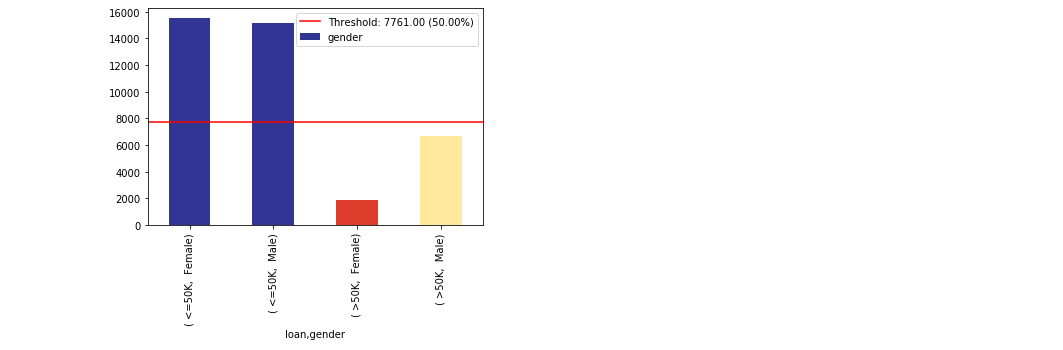
View imbalance of one column intersected with another
im = xai.show_imbalance(df, "gender", cross=["loan"])
Balance the class using upsampling and/or downsampling
bal_df = xai.balance(df, "gender", cross=["loan"], upsample=1.0)
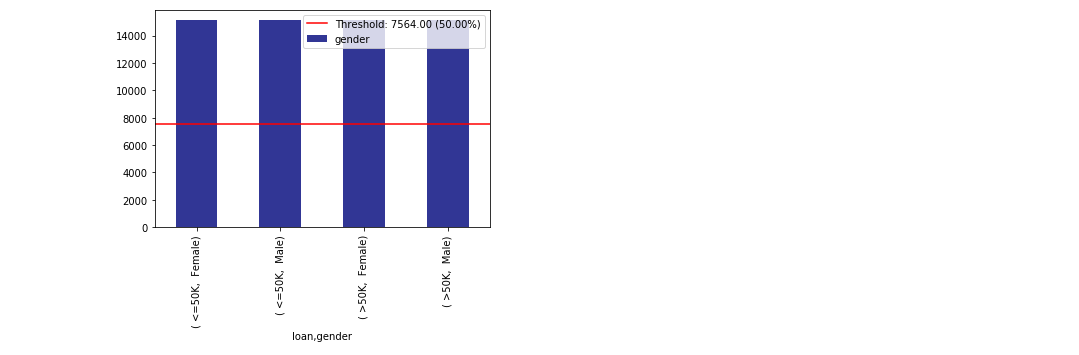
Create a balanced test-train split (should be done pre-balancing)
# Balanced train-test split with minimum 300 examples of
# the cross of the target y and the column gender
x_train, y_train, x_test, y_test = xai.balanced_train_test_split(
            x, y, cross=["gender"],
            categorical_cols=categorical_cols, min_per_class=300)

# Visualise the imbalances of gender and the target
df_test = x_test.copy()
df_test["loan"] = y_test
_= xai.show_imbalance(df_test, "gender", cross=["loan"], categorical_cols=categorical_cols)
2) Model Evaluation
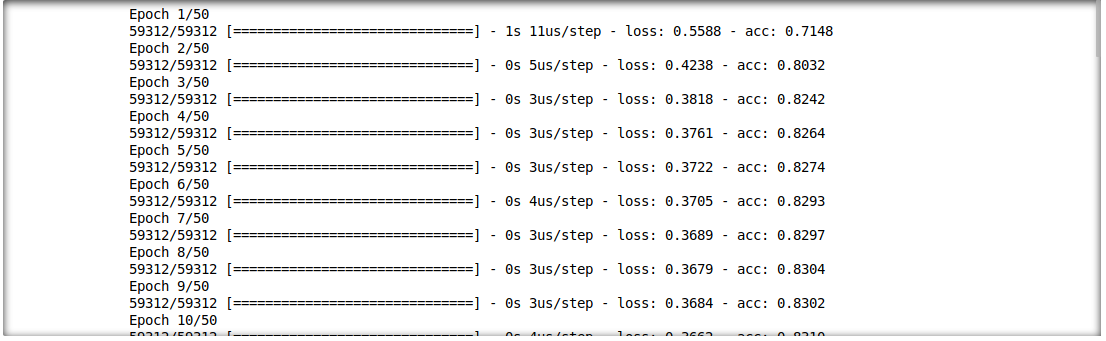
We are able to also analyse the interaction between inference results and input features. For this, we will train a single layer deep learning model.
model = build_model(proc_df.drop("loan", axis=1))
model.fit(f_in(x_train), y_train, epochs=50, batch_size=512)

probabilities = model.predict(f_in(x_test))
predictions = list((probabilities >= 0.5).astype(int).T[0])
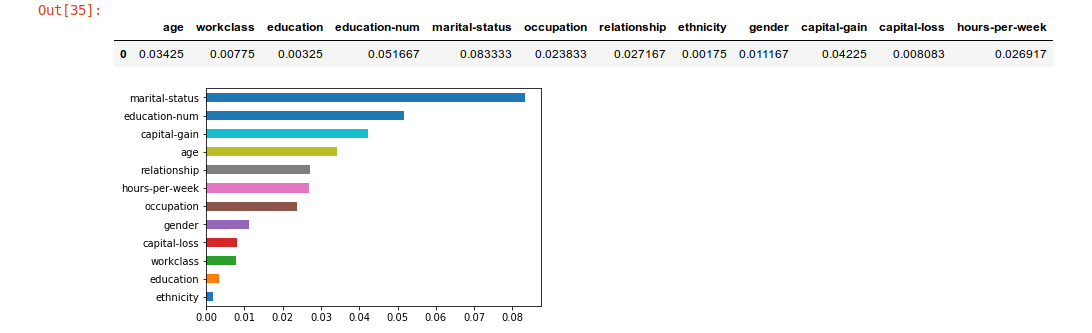
Visualise permutation feature importance
def get_avg(x, y):
    return model.evaluate(f_in(x), y, verbose=0)[1]

imp = xai.feature_importance(x_test, y_test, get_avg)

imp.head()
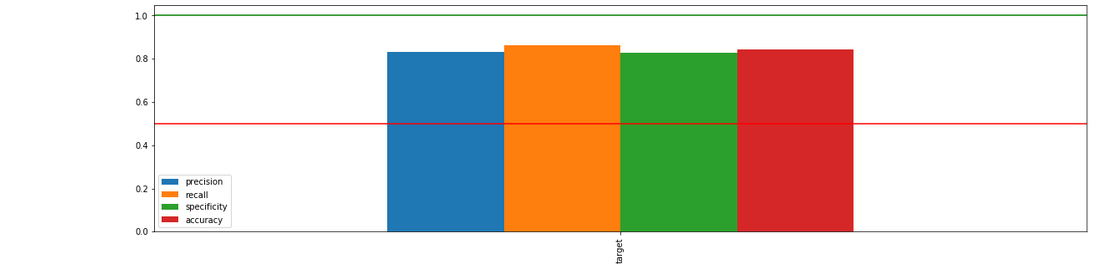
Identify metric imbalances against all test data
_= xai.metrics_imbalance(
        x_test,
        y_test,
        probabilities)
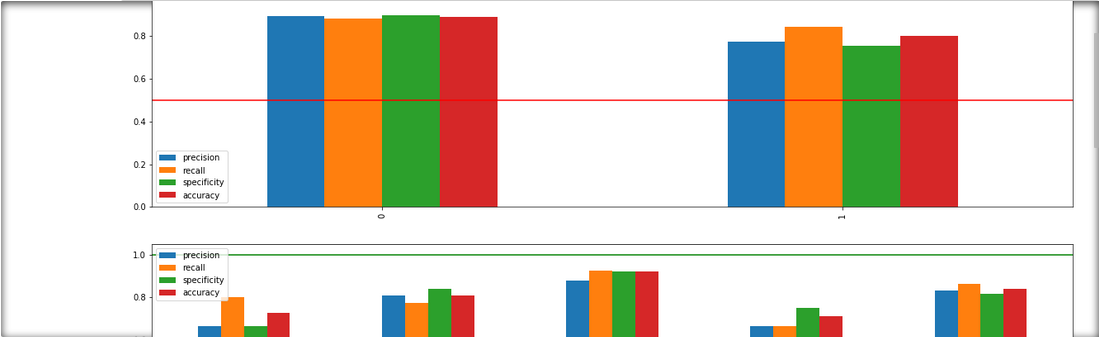
Identify metric imbalances grouped by protected columns
_= xai.metrics_imbalances(
        x_test,
        y_test,
        probabilities,
        columns=protected,
        categorical_cols=categorical_cols)
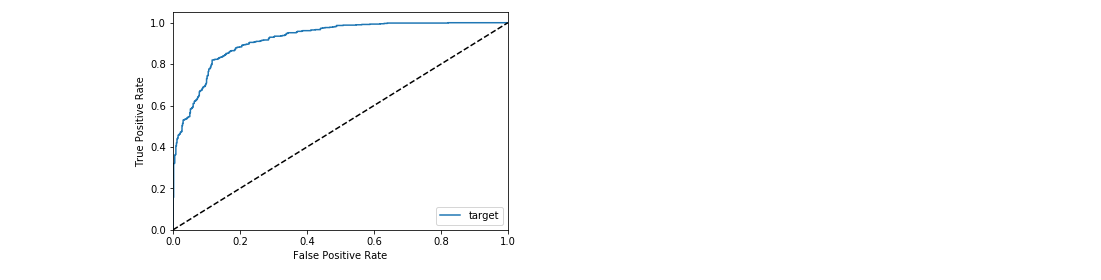
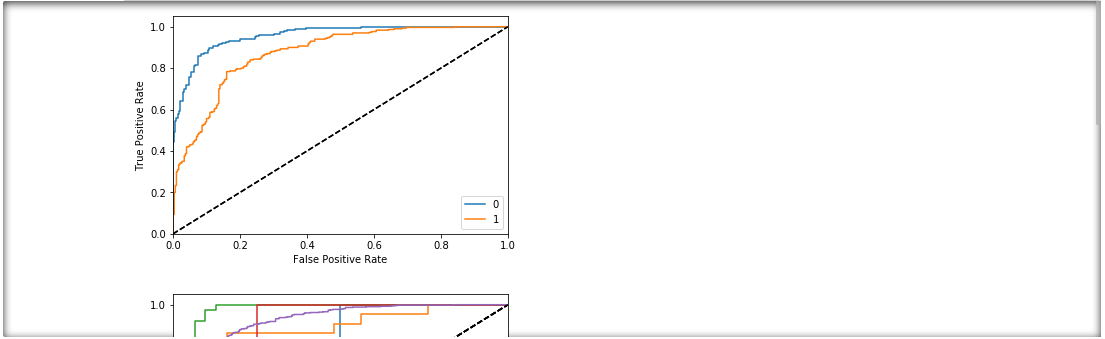
Visualise the ROC curve against all test data
_= xai.roc_imbalance(
       x_test,
       y_test,
       probabilities)
Visualise the ROC curves grouped by protected columns
_= xai.roc_imbalances(
    x_test,
    y_test,
    probabilities,
    columns=protected,
    categorical_cols=categorical_cols)
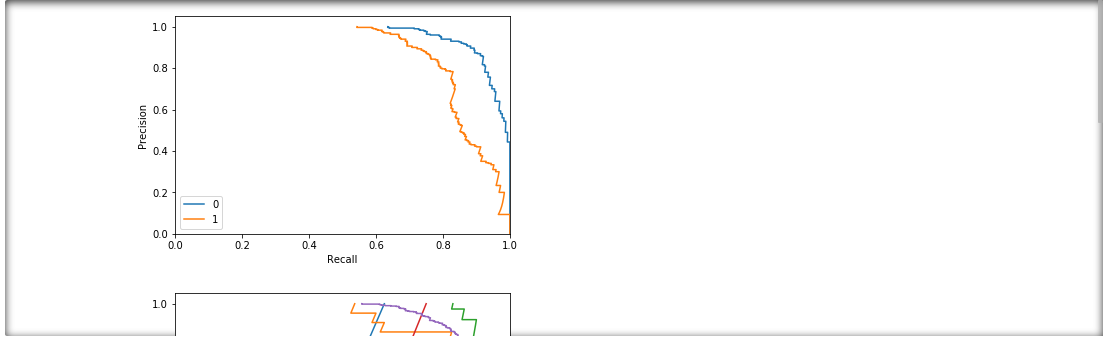
Visualise the precision-recall curve by protected columns
_= xai.pr_imbalances(
    x_test,
    y_test,
    probabilities,
    columns=protected,
    categorical_cols=categorical_cols)
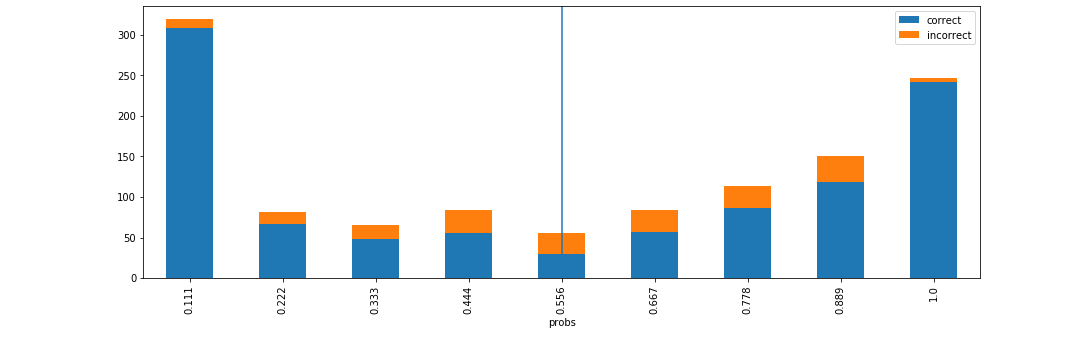
Visualise accuracy grouped by probability buckets
d = xai.smile_imbalance(
    y_test,
    probabilities)
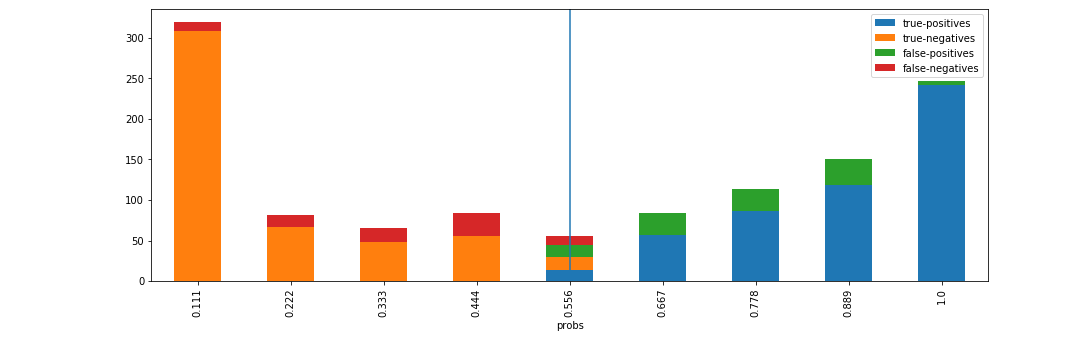
Visualise statistical metrics grouped by probability buckets
d = xai.smile_imbalance(
    y_test,
    probabilities,
    display_breakdown=True)
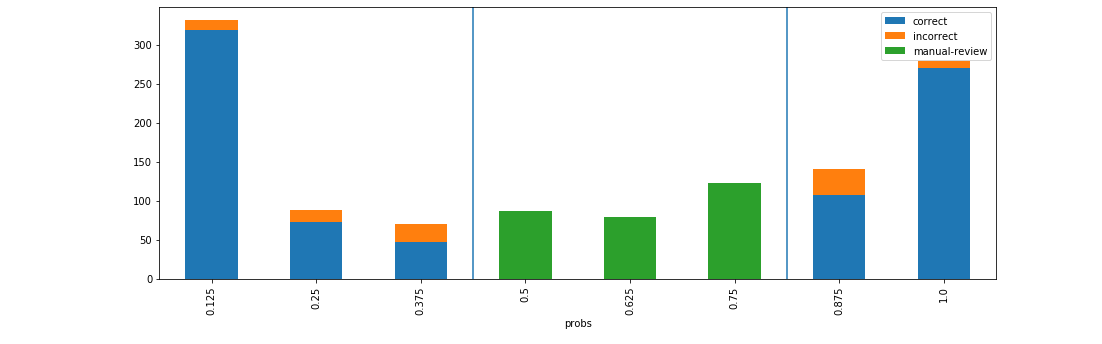
Visualise benefits of adding manual review on probability thresholds
d = xai.smile_imbalance(
    y_test,
    probabilities,
    bins=9,
    threshold=0.75,
    manual_review=0.375,
    display_breakdown=False)
xai Python Docstrings
Submodules
xai.data module
- xai.data.load_census(return_xy=False)
Load adult census dataset with column as “loan” instead of “target” to use during examples to “automate a loan approval process”.
- Example:
from xai.data import load_census df = load_census()
- Parameters:
return_xy (bool) – [default: False] pass True if you would like to return the data as X, y where X are the input columns and y is the target. If nothing (or False) is provided, the default return will be the full dataframe.
- Returns:
Dataframe with full contents OR dataframe with inputs and array with targets.
- Return type:
(pandas.DataFrame, Optional[numpy.array])
Module contents
- xai.balance(df, *cross_cols, upsample=0.5, downsample=1, bins=6, categorical_cols=[], plot=True)
- Balances a dataframe based on the columns and cross columns provided.
The results can be upsampled or downsampled. By default, there is no downsample, and the upsample is towards a minimum of 50% of the frequency of the highest class.
- Example:
- cat_df = xai.balance(
df, “gender”, “loan”, upsample=0.8, downsample=0.8)
- Parameters:
df (pandas.DataFrame) – Pandas Dataframe containing data (inputs and target )
*cross_cols –
One or more positional arguments (passed as *args) that
are used to split the data into the cross product of their values :type cross_cols: List[str] :type upsample:
float:param upsample: [Default: 0.5] Target upsample for columns lowerthan percentage.
- Parameters:
downsample (float) – [Default: 1] Target downsample for columns higher than percentage.
bins (int) – [Default: 6] Number of bins to be used for numerical cols
categorical_cols (List[str]) – [Default: []] Columns within dataframe that are categorical. Columns that are not np.objects and are not part explicitly provided here will be treated as numeric, and bins will be used.
threshold (float) – [Default: 0.5] Threshold to display in the chart.
- Returns:
Dataframe with categorical numerical values.
- Return type:
pandas.DataFrame
- xai.balanced_train_test_split(x, y, *cross_cols, categorical_cols=[], min_per_group=20, max_per_group=None, fallback_type='upsample', bins=6, random_state=None)
Splits the “x” DataFrame and “y” Array into train/test split training sets with a balanced number of examples for each of the categories of the columns provided. For example, if the columns provided are “gender” and “loan”, the resulting splits would contain an equal number of examples for Male with Loan Approved, Male with Loan Rejected, Female with Loan Approved, and Female with Loan Rejected. The “fallback_type” parameter provides the behaviour that is triggered if there are not enough datapoint examples for one of the subcategory groups - the default is “half”
Example
x: pd.DataFrame # Contains the input features
y: np.array # Contains the labels for the data
categorical_cols: List[str] # Name of columns that are categorical

x_train, y_train, x_test, y_test, train_idx, test_idx = \
    xai.balanced_train_test_split(
            x, y, balance_on=["gender"],
            categorical_cols=categorical_cols, min_per_group=300,
            fallback_type="half")
- Parameters:
x (
DataFrame) – Pandas dataframe containing all the features in datasety (
Union[ndarray,list]) – Array containing “actual” labels for the dataset*cross_cols (
str) – One or more positional arguments (passed as *args) that are used to split the data into the cross product of their valuescategorical_cols (
List[str]) – [Default: []] Columns within dataframe that are categorical. Columns that are not np.objects and are not part explicitly provided here will be treated as numeric, and bins will be used.min_per_group (
int) – [Default: 20] This is the number of examples for each of the groups createdmax_per_group (
Optional[int]) – [Default: None] This is the maximum number of examples for each group to be provided with.fallback_type (
str) –[Default: upsample] This is the fallback mechanism for when one of the groups contains less elements than the number provided through min_per_group. The options are “upsample”, “ignore” and “error”.
”upsample”: This will get samples with replacement so will repeat elements
”ignore”: Will just ignore and return all the elements available
”error”: Throw an exception for any groups with less elements
bins (
int) – [Default: 6] Number of bins to be used for numerical colsrandom_state (
int) – [Default: None] Random seed for the internal sampling
- Return type:
Tuple[DataFrame,ndarray,DataFrame,ndarray,ndarray,ndarray]- Returns:
x_train (pd.DataFrame) – DataFrame containing traning datapoints
y_train (np.ndarray) – Array containing labels for training datapoints
x_test (pd.DataFrame) – DataFrame containing test datapoints
y_test (np.ndarray) – Array containing labels for test datapoints
train_idx (np.ndarray) – Boolean array with True on Training indexes
test_idx (np.ndarray) – Boolean array with True on Testing indexes
- xai.confusion_matrix_plot(y_test, pred, scaled=True, label_x_neg='PREDICTED NEGATIVE', label_x_pos='PREDICTED POSITIVE', label_y_neg='ACTUAL NEGATIVE', label_y_pos='ACTUAL POSITIVE')
Plots a confusion matrix for a binary classifier with the expected and predicted values provided.
- Example:
- xai.confusion_matrix_plot(
actual_labels, predicted_labels, scaled=True)
- Parameters:
y_test (Union[np.array, list]) – Array containing binary “actual” labels for data
pred (Union[np.array, list]) – Array containing binary “predictedd” labels for data
scaled (bool) – [Default: True] Whether the values are scaled to 0-1 or
displayed as total number of instances :type scaled: bool :type label_x_neg: str :param label_x_neg: [Default: “PREDICTED NEGATIVE”] Plot label for the predicted negative values :type label_x_neg: str :type label_x_pos: str :param label_x_pos: [Default: “PREDICTED POSITIVE”] Plot label for the predicted positive values :type label_x_pos: str :type label_y_neg: str :param label_y_neg: [Default: “ACTUAL NEGATIVE”] Plot label for the actual negative values :type label_y_neg: str :type label_y_pos: str :param label_y_pos: [Default: “ACTUAL POSITIVE”] Plot label for the actual positive values :type label_y_pos: str :returns: Null :rtype: None
- xai.convert_categories(df, categorical_cols=[])
- Converts columns to numeric categories. If the categorical_cols
parameter is passed as a list then those columns are converted. Otherwise, all np.object columns are converted.
- Example:
import xai cat_df = xai.convert_categories(df)
- Parameters:
df (pandas.DataFrame) – Pandas Dataframe containing data (inputs and target)
categorical_cols (str) – List of strings containing categorical cols
- Returns:
Dataframe with categorical numerical values.
- Return type:
pandas.DataFrame
- xai.convert_probs(probs, threshold=0.5)
Converts all the probabilities in the array provided into binary labels as per the threshold provided which is 0.5 by default.
Example
probs = np.array([0.1, 0.2, 0.7, 0.8, 0.6])
labels = xai.convert_probs(probs, threshold=0.65)
print(labels)

> [0, 0, 1, 1, 0]
- Parameters:
probs (
ndarray) – Numpy array or list containing a list of floats between 0 and 1threshold (
float) – Float that provides the threshold for which probabilities over the threshold will be converted to 1
- Return type:
ndarray- Returns:
np.ndarray – Numpy array containing the labels based on threshold provided
- xai.correlations(df, include_categorical=False, plot_type='dendogram', plt_kwargs={}, categorical_cols=[])
Computes the correlations for the columns provided and plots the relevant image as requested by the parameters.
- Example:
- cat_df = xai.balance(
df, “gender”, “loan”, upsample=0.8, downsample=0.8)
- Parameters:
df (pandas.DataFrame) – Pandas Dataframe containing data (inputs and target )
*cross_cols –
One or more positional arguments (passed as *args) that
are used to split the data into the cross product of their values :type cross_cols: List[str] :param upsample: [Default: 0.5] Target upsample for columns lower
than percentage.
- Parameters:
downsample (float) – [Default: 1] Target downsample for columns higher than percentage.
bins (int) – [Default: 6] Number of bins to be used for numerical cols
categorical_cols (List[str]) – [Default: []] Columns within dataframe that are categorical. Columns that are not np.objects and are not part explicitly provided here will be treated as numeric, and bins will be used.
threshold (float) – [Default: 0.5] Threshold to display in the chart.
- Returns:
Returns a dataframe containing the correlation values for the features
- Return type:
pandas.DataFrame
- xai.evaluation_metrics(y_valid, y_pred)
Calculates model performance metrics (accuracy, precision, recall, etc) from the actual and predicted lables provided.
Example
y_actual: np.ndarray
y_predicted: np.ndarray

metrics = xai.evaluation_metrics(y_actual, y_predicted)
for k,v in metrics.items():
    print(f"{k}: {v}")

> precision: 0.8,
> recall: 0.9,
> specificity: 0.7,
> accuracy: 0.8,
> auc: 0.7,
> f1: 0.8
- Parameters:
y_valid – Numpy array with the actual labels for the datapoints
y_pred – Numpy array with the predicted labels for the datapoints
- Return type:
Dict[str,float]- Returns:
Dict[str, float] – Dictionary containing the metrics as follows:
return {
    "precision": precision,
    "recall": recall,
    "specificity": specificity,
    "accuracy": accuracy,
    "auc": auc,
    "f1": f1
}
- xai.feature_importance(x, y, func, repeat=10, plot=True)
- xai.group_by_columns(df, columns, bins=6, categorical_cols=[])
- Groups dataframe by the categories (or bucketized values) for all columns provided.
If categorical it uses categories, if numeric, it uses bins. If more than one column is provided, the columns provided are, for example, age and binary_target_label, then the result would be a pandas DataFrame that is grouped by age groups for each of the positive and negative/positive labels.
- Example:
columns=[“loan”, “gender”] df_groups = xai.group_by_columns(
df, columns=columns, bins=10, categorical_cols=[“gender”, “loan”])
- for group, df_group in df_groups:
print(group) print(grouped_df.head())
- Parameters:
df (pandas.DataFrame) – Pandas Dataframe containing data (inputs and target)
bins (int) – [Default: 6] Number of bins to be used for numerical cols
categorical_cols (List[str]) – [Default: []] Columns within dataframe that are categorical. Columns that are not np.objects or np.bool and are not part explicitly provided here will be treated as numeric, and bins will be used.
- Returns:
Dataframe with categorical numerical values.
- Return type:
pandas.core.groupby.groupby.DataFrameGroupBy
- xai.imbalance_plot(df, *cross_cols, categorical_cols=[], bins=6, threshold=0.5)
- Shows the number of examples provided for each of the values across the
product tuples in the columns provided. If you would like to do processing with the sub-groups created by this class please see the group_by_columns function.
- Example:
import xai class_counts = xai.imbalance_plot(
df, “gender”, “loan”, bins=10, threshold=0.8)
- Parameters:
df (pandas.DataFrame) – Pandas Dataframe containing data (inputs and target)
*cross_cols –
One or more positional arguments (passed as *args) that are used to split the data into the cross product of their values
categorical_cols (List[str]) – [Default: []] Columns within dataframe that are categorical. Columns that are not np.objects and are not part explicitly provided here will be treated as numeric, and bins will be used.
bins (int) – [Default: 6] Number of bins to be used for numerical cols
threshold (float) – [Default: 0.5] Threshold to display in the chart.
- Returns:
Null
- Return type:
None
- xai.metrics_plot(target, predicted, df=Empty DataFrame Columns: [] Index: [], cross_cols=[], categorical_cols=[], bins=6, plot=True, exclude_metrics=[], plot_threshold=0.5)
Creates a plot that displays statistical metrics including precision, recall, accuracy, auc, f1 and specificity for each of the groups created for the columns provided by cross_cols. For example, if the columns passed are “gender” and “age”, the resulting plot will show the statistical metrics for Male and Female for each binned group.
Example
target: np.ndarray
predicted: np.ndarray

df_metrics = xai.metrics_plot(
                target,
                predicted,
                df=df_data,
                cross_cols=["gender", "age"],
                bins=3
- Parameters:
target (
ndarray) – Numpy array containing the target labels for the datapointspredicted (
ndarray) – Numpy array containing the predicted labels for the datapointsdf (
DataFrame) – Pandas dataframe containing all the features for the datapoints. It can be empty if only looking to calculate global metrics, but if you would like to compute for categories across columns, the columns you are grouping by need to be providedcross_cols (
List[str]) – Contains the columns that you would like to use to cross the valuesbins (
int) – [Default: 6] The number of bins in which you’d like numerical columns to be splitplot (
bool) – [Default: True] If True a plot will be drawn with the resultsexclude_metrics (
List[str]) – These are the metrics that you can choose to exclude if you only want specific ones (for example, excluding “f1”, “specificity”, etc)plot_threshold (
float) – The percentage that will be used to draw the threshold line in the plot which would provide guidance on what is the ideal metrics to achieve.
- Return type:
DataFrame- Returns:
pd.DataFrame – Pandas Dataframe containing all the metrics for the groups provided
- xai.normalize_numeric(df, numerical_cols=[])
- Normalizes numeric columns by substracting the mean and dividing
by standard deviation. If the parameter numerical_cols is not provided, it will take all the columns of dtype np.number.
- Example:
- norm_df = xai.normalize_numeric(
df, normalize_numeric=[“age”, “other_numeric_attribute”])
- Parameters:
df (pd.DataFrame) – Pandas Dataframe containing data (inputs and target)
numerical_cols (
List[str]) – List of strings containing numercial cols
- Returns:
Dataframe with normalized numerical values.
- Return type:
pandas.DataFrame
- xai.pr_plot(target, predicted, df=Empty DataFrame Columns: [] Index: [], cross_cols=[], categorical_cols=[], bins=6, plot=True)
- xai.roc_plot(target, predicted, df=Empty DataFrame Columns: [] Index: [], cross_cols=[], categorical_cols=[], bins=6, plot=True)
- xai.smile_imbalance(y_test, probs, threshold=0.5, manual_review=None, display_breakdown=False, bins=10)